.png?width=250&height=27&name=AT%20-%20LOGO%20-%20BLACK%20-With%20White%20House%20(2).png "audience-town")
.png)
Updated September 2026 with findings from our first State of Home Builder Marketing report.
In March we called 2026 a year of discipline. Six months later we have the data to say what that discipline requires. Our first State of Home Builder Marketing report ran the Whengine® across 201,000 closed home sales in 25 markets and 373 million website sessions across 135 home builders.
The buyers are still out there. They're harder to find than the category assumes, and the builders who find them first will set the pace in 2027.
Download the full State of Home Builder Marketing 2026 report for all 25 markets and nine specific changes to make before 2027 planning closes.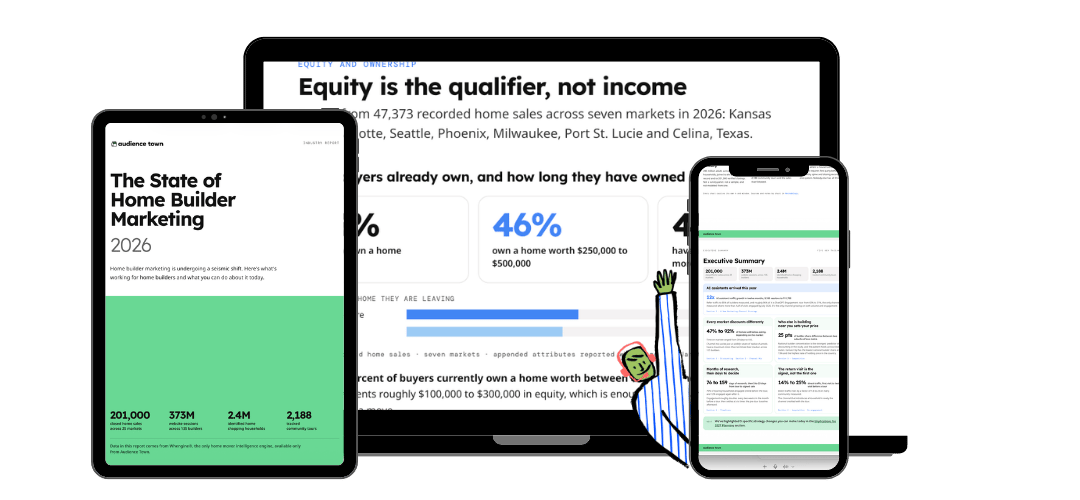
The builders who treat it that way will outperform the ones still waiting for conditions to normalize.
Every market sold below asking, by very different amounts
Homes sold below asking in every one of the 25 markets we studied over the 12 months ending August 2026. How far below depended almost entirely on where you build.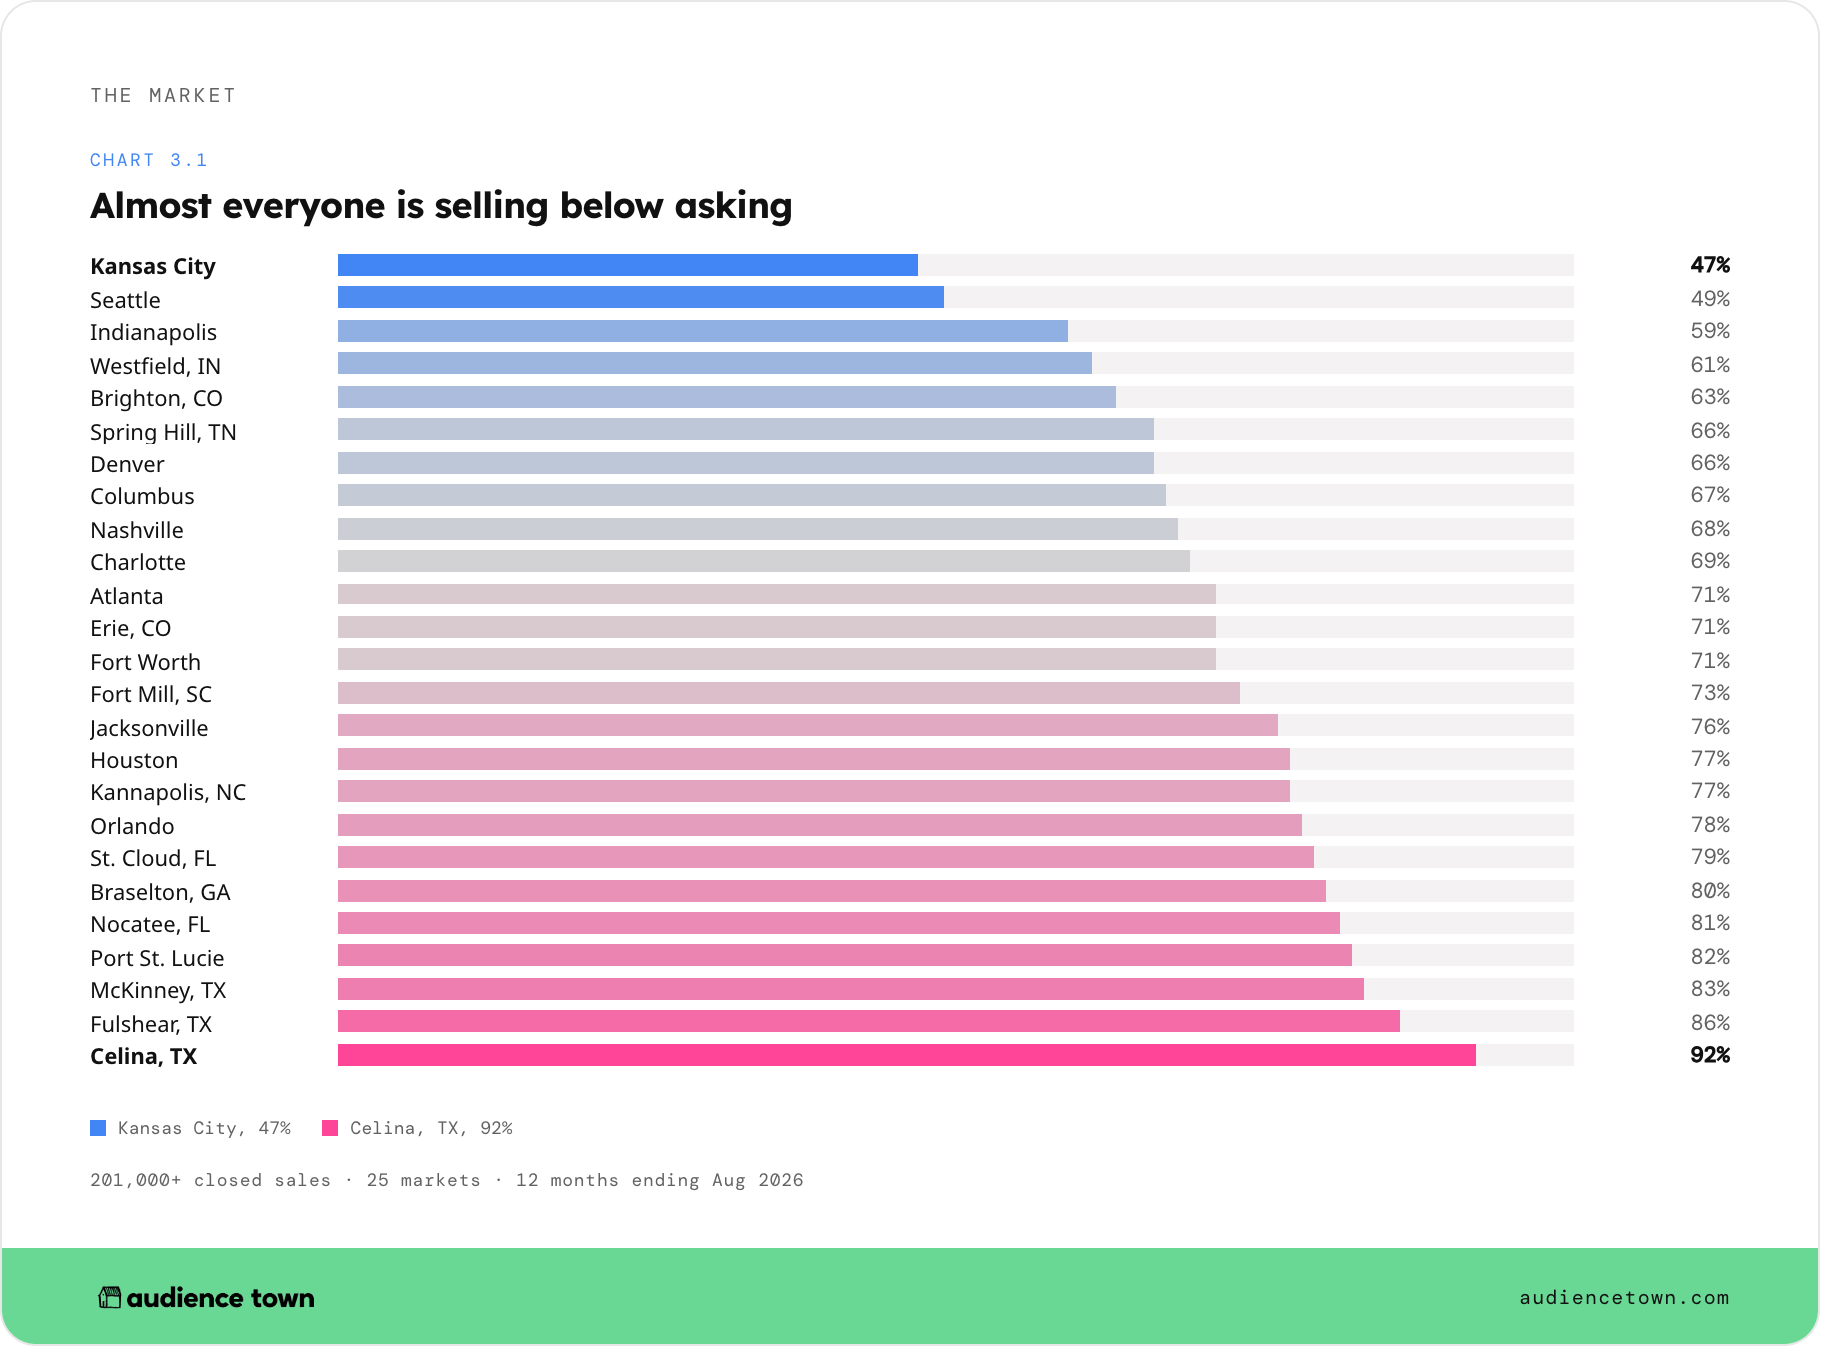
Slower markets discounted more. Celina, the slowest market in the study, took a median 105 days to sell a home. Rates haven't helped either, climbing back to around 7% from the roughly 6% where they started the year.
Builders have been cautious on land and community starts, and given where affordability sits, that caution is rational. But a constrained market still has buyers in it, and the rest of this post is about finding them.
The biggest predictor of discounting is who else is building near you. Where national builders hold a larger share of new construction, homes discount more. Two Denver suburbs make the point. In Brighton, national builders hold 50% of the market and 32% of homes sold at or above asking. In Erie, at 75%, just 21% did.
Texas stands out. Only 18% of new homes in Texas metros sold at or above asking, against 42% in the Midwest.
Before you treat a discount as a performance problem, find out what normal looks like where you build. A discount rate that signals trouble in one market is ordinary in another.
Incentives are table stakes, and spreading them thin is expensive
For most builders, 2026 feels like running in sand. Volume is down, and incentives are eating into margins that were already thin.
Rate buydowns and closing cost assistance no longer set a builder apart. Nearly everyone offers them, and builders are absorbing the cost to keep traffic moving through their communities. When incentive spend isn't targeted, it lands on buyers who were going to purchase anyway and on buyers who were never going to close, with very little ability to tell the two apart.
The competitive pressure makes it harder. National builders have spent years building data infrastructure and advertising technology that most regional and mid-size builders can't match dollar for dollar, and the gap is widening. That fits the pattern in our data: where national builders hold more of the market, discounting runs deeper.
Listing portals are showing their limits too. They serve ads for competing communities and return little intelligence about who is engaging and why. Our data shows the pattern. Listing services introduce households, but their share falls between a household's first visit and its last visit before a tour. They remain a useful source of new shoppers. They aren't a foundation you control.
Equity buys the house, not income
Across 47,373 home sales in seven markets from January to September 2026, the typical buyer was already a homeowner with equity to move.
The income picture looks very different. Almost half of buyers earn under $100,000, yet a third hold a net worth above $1 million and 22% above $2.5 million. A third could afford a home priced above $1 million, while only 12% own one today.
Income only tells part of the story. The household that buys isn't necessarily the one earning the most; it's often the household sitting on a home worth enough to support a move. Consider using current home value for your audience targeting.
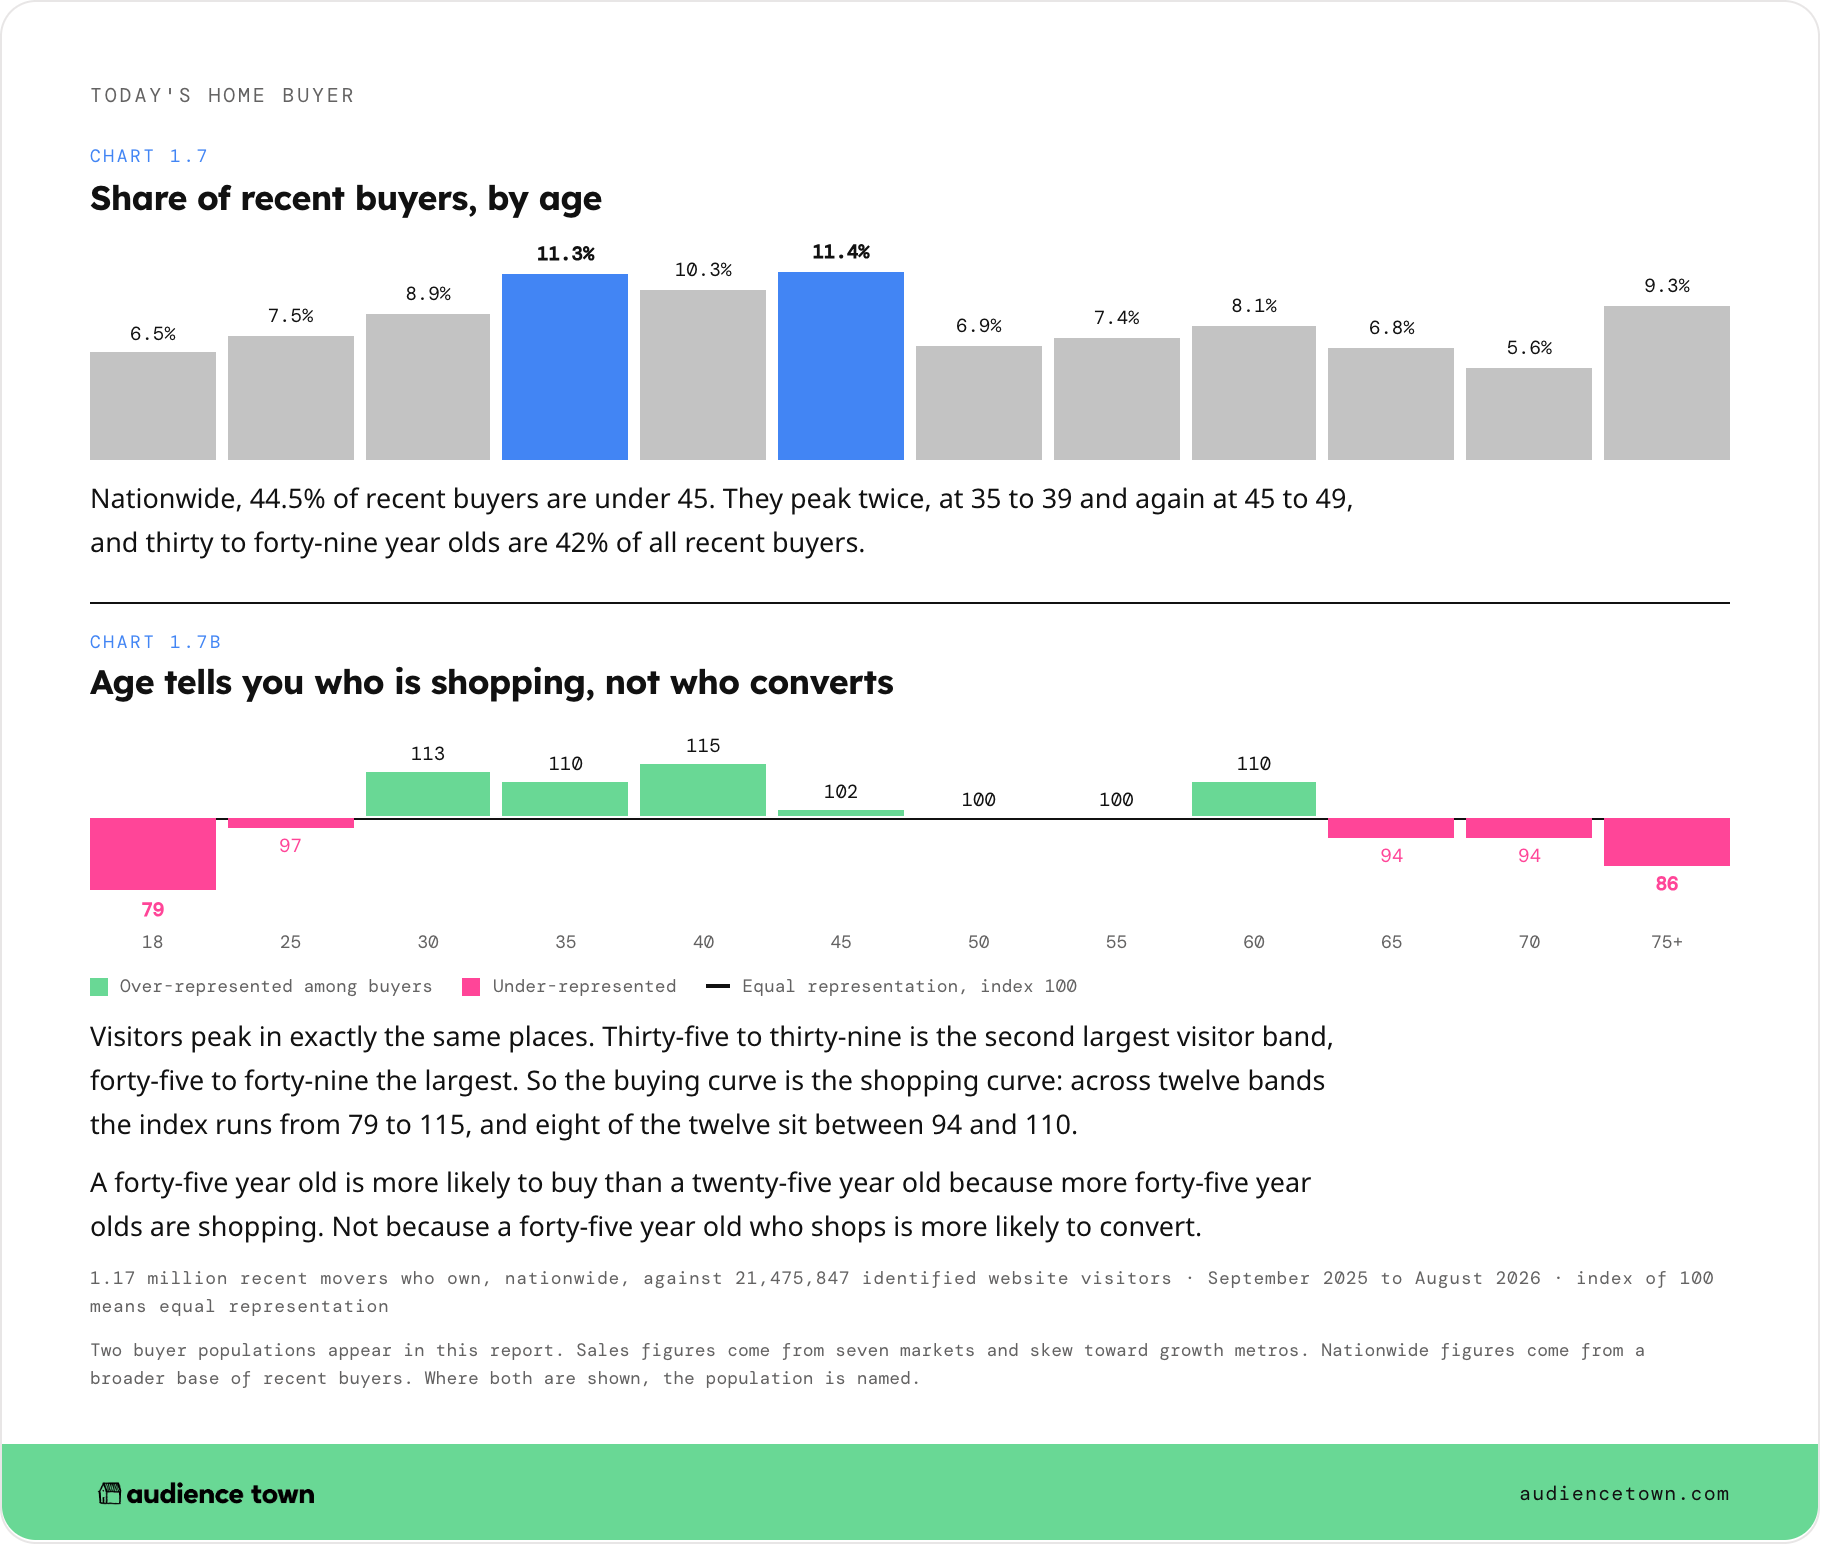
Age works the same way. Buyers cluster in their late thirties and forties, but so do website visitors. Nationally, the age mix of recent buyers almost exactly matches the age mix of people browsing builder websites. Age tells you who is shopping, not who converts.
Buyers also move shorter distances than the migration story suggests. In Celina, TX, every 2026 buyer came from within Texas, and 91% came from neighboring communities. In Kansas City, 86% came from inside the metro. Even in Port St. Lucie, FL, a magnet for out-of-state retirees, 72% of buyers came from within Florida.
The money goes further on local reach, geofencing competitor communities, and mail to identified in-market households inside the metro. Audience Town lets you resolve out-of-state buyers to specific ZIP codes, which enables targeting even when blanketing a whole state isn't feasible.
The full buyer profile is in the report, including affordability and prior residence by market. Download it here.
Half of recent sellers gave up a mortgage under 4%
In March we wrote that rate lock was keeping homeowners with sub-4% mortgages in place. The sales data now shows that shifting.
Among the most recent 3,499 sales in our data, 23.9% of sellers held a mortgage rate between 2% and 3%, and another 25.8% held one between 3% and 4%. Nearly half gave up a rate under 4% to move. Across the full year, a third did.
Rate lock has been the industry's explanation for weak demand for three years. These buyers moved regardless. They're still rate sensitive, but whatever moved them outweighed a mortgage worth tens of thousands of dollars over its life. The reason to move was bigger than the reason to stay.
Buyers decide on the monthly payment
With rates around 7%, sticker price is almost a distraction. Buyers decide on the monthly payment, and even the equity-rich buyers in our data are rate sensitive. Builders who shape incentives around the payment, through rate buydowns and closing cost assistance, and communicate them clearly and early, give those buyers a number they can act on.
Precision matters here as much as the offer. The household most likely to act is the one with equity and a reason to move, so an incentive works hardest when it reaches that household at the right moment in its decision.
Buyers research for months, then decide in weeks
Across 2,188 households with tracked community tours:
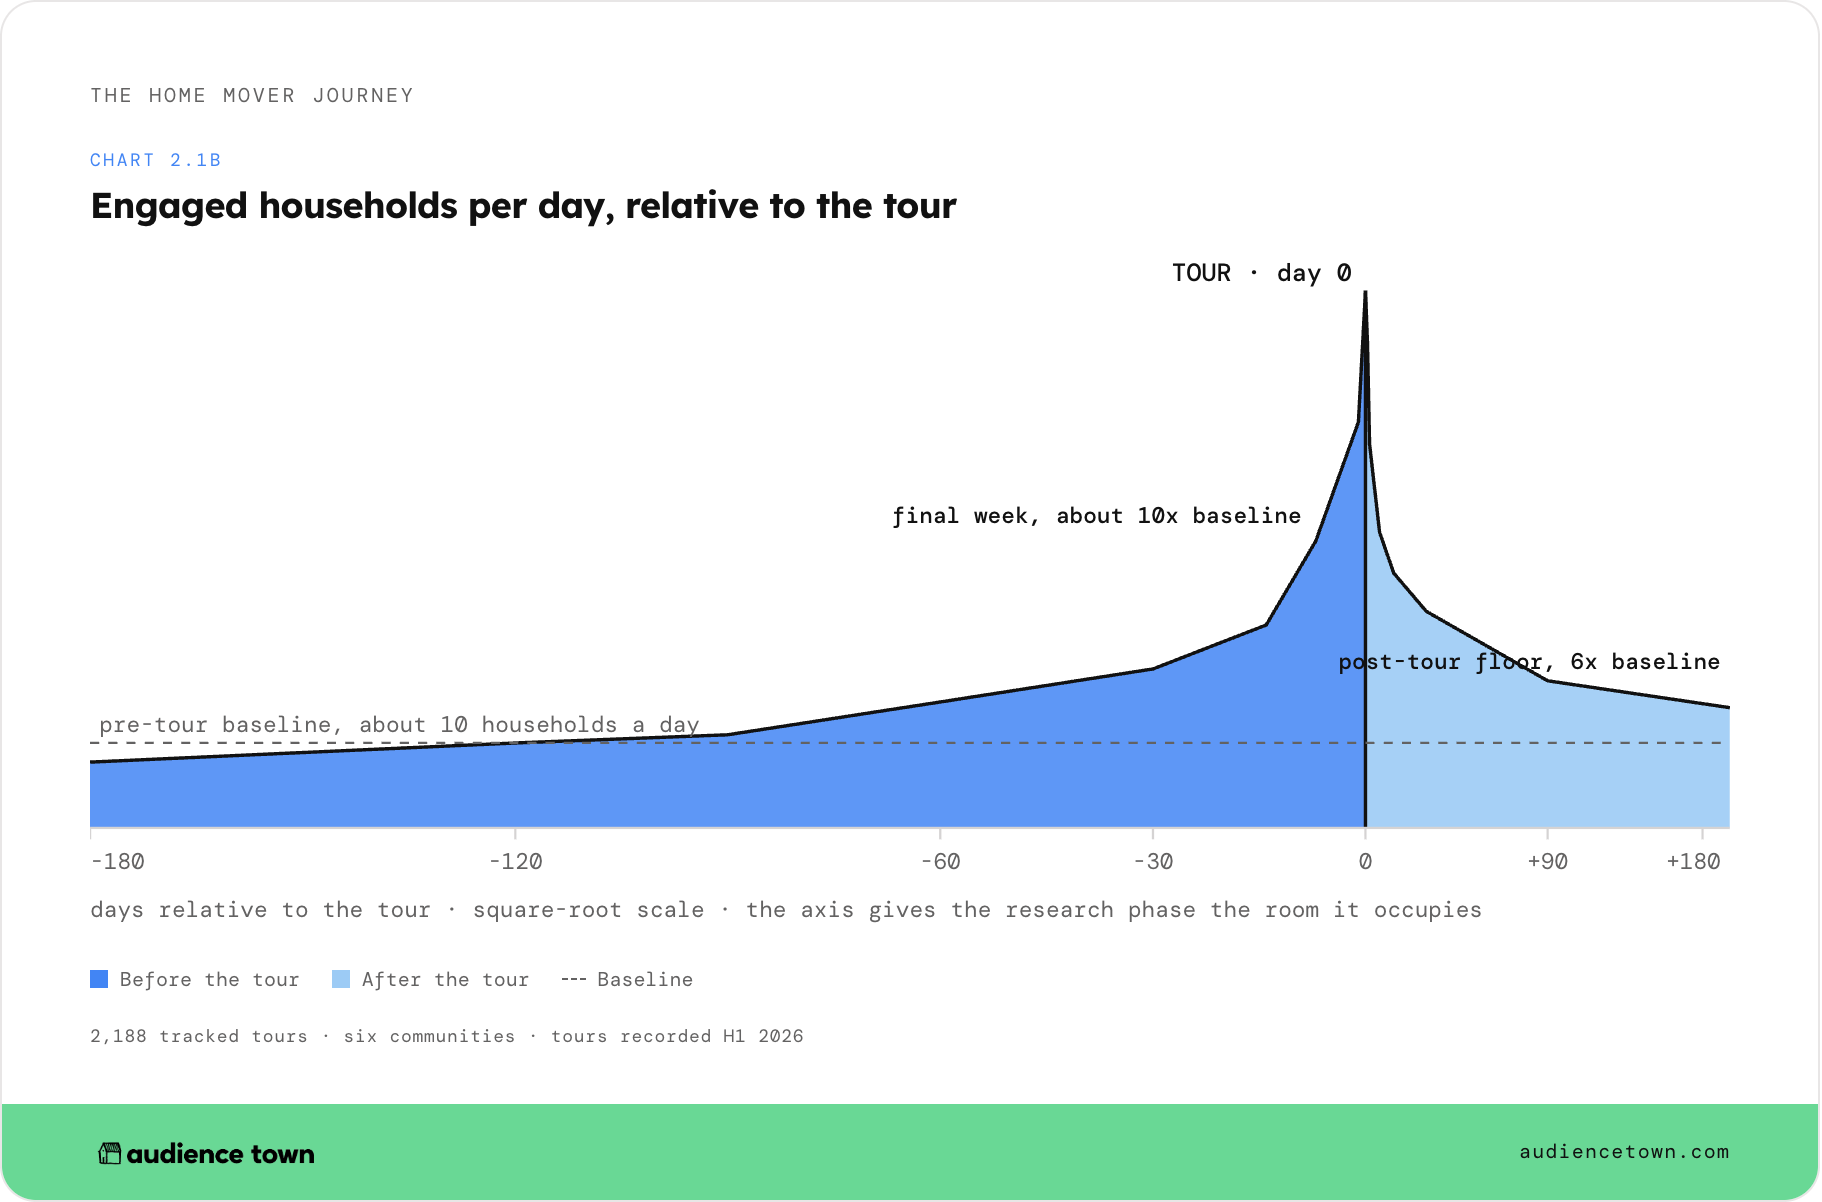
Research runs for months and the decision after a tour runs days. Engagement also accelerates on a schedule: in the month before a tour, the number of engaged households roughly doubles every two weeks. After the tour it settles at six times the pre-tour baseline and holds there for months.
The tour sits in the middle of the digital journey. Buyers engage almost as much after it as before.
That makes a quiet household worth watching. The buyer who visited a community six weeks ago and never filled out a form may be halfway through a research phase that runs 76 to 159 days. By the time someone submits a form or calls a sales center, they have usually shortlisted communities and formed strong preferences. What matters is whether you stay visible while they decide, or go dark and hand the relationship to a competitor who doesn't.
The return visit is the signal. Direct traffic, meaning visitors who type the address or use a bookmark, rises from 14.3% of first visits to 24.7% of the last visit before a tour. A household that comes back under your name knows exactly where it's shopping. If you score leads, score them on the return. First touch tells you where a household came from. The second visit tells you whether they're still there.
When interest shows up, it shows up fast. Of visitors who ever submit a form, 81% do it on their first engaged visit.
Standard attribution windows are shorter than the research phase. Everything that moves a buyer happens in the months before a tour, and most analytics solutions don't give you that visibility, much less allow you to act on it.
Paid social is the biggest channel and the lowest engaging
Twelve months of sessions on home builder websites, September 2025 to August 2026. Engagement is the median across builders, where an engaged visit means two or more pages or 30 seconds on site.
|
Channel |
Sessions |
Median engaged |
|---|---|---|
|
Organic search |
57.0M |
45.2% |
|
Local listings |
3.9M |
41.0% |
|
AI assistants |
325K |
33.0% |
|
Paid search |
17.5M |
27.9% |
|
Direct |
86.0M |
25.6% |
|
Paid social |
79.3M |
12.3% |
Paid social brings in nearly 80 million sessions a year and engages fewer of them than any other major channel. It buys reach among people who don't know you yet, so it will always look weaker on engagement. Judge acquisition channels on the households they introduce, and re-engagement channels on returns.
There's no standard mix either. Organic search is the largest discovery channel for the median builder, at 38.6% of first visits, but across most builders it lands anywhere from 17% to 67%. Paid search runs from 1% to 47%, and paid social from under 1% to 33%. Every builder has a different mix and every buyer takes a different path, so the benchmark that matters is your own.
AI assistants arrived this year. Monthly sessions from AI assistants grew from 9,100 in August 2025 to 111,700 in August 2026, twelve times in a year. About 96% of it comes from ChatGPT, and 95% of builders now receive some. Measured month to month, AI engagement rose from 41.8% to 50.9%, the highest of any channel in August. The annual figure in the table is lower because it blends in the earlier months. AI still accounts for just 0.13% of first engaged visits, and Google's AI Overviews don't appear here at all, since they land in organic search.
Targeted direct mail deserves a second look. Across six builders and 51 campaigns sent to identified in-market households, median engagement was 14.6%.
Demographics barely separate buyers from browsers, so reach has to run on intent
Across this report, demographic attributes keep failing to separate the households that buy from the ones that browse. Households arriving from different channels look broadly alike on income and home value. Income runs backwards against buying power. And age tracks who is shopping, not who converts.
Reach channels need intent data. Connected TV, display, streaming audio and geofencing work hardest when they run on signals that a household is likely to move soon, not on a demographic profile alone. Reaching a household the data says is about to move is demand generation. Reaching one that simply fits a demographic is brand spend. Both have a role, but the next dollar should favor the first.
Re-engagement has to cover the whole return window. Engagement doubles every two weeks in the month before a tour, then holds well above baseline for months afterward. Pixel-based website retargeting catches part of that window at best. That window is where re-engagement pays off, and it takes the right message at the right moment, across more than one channel.
Attribution has to close the loop. The channel that gets credit for the tour is rarely the channel that did the work. Direct traffic has no campaign behind it and no budget line, so nothing in a standard report surfaces it as a win. Builders who can see which channels contribute to sales, and not only to leads, make better budget decisions.
Three questions to bring into 2027 planning
The builders who set the pace next year will find the right buyers sooner and reach them at the right moment. Start with these:
- Are we comparing our discounting and pricing against national figures or against our own metro?
- How much of our first-visit traffic arrives already knowing our name, and what is producing it?
- What share of our reported traffic represents an engaged visit?
Each of those is answerable with the right data. Audience Town is the first and only end-to-end marketing platform built specifically for home builders. Our Whengine identifies households as they move through the home journey, and it powers both analytics and precision advertising in one system. Builders can reach in-market home movers across connected TV, digital display, streaming audio, geofencing, Meta retargeting and targeted direct mail, and measure results in the same platform they use for attribution.
Nobody is winning this market on volume anymore. Precision is the only thing left.
Get the full State of Home Builder Marketing 2026 report for all 25 markets and nine specific changes to make before 2027 planning closes. Download it here.

Ready to see what precision advertising looks like for your communities? Get started today.