We shipped more than 900 updates to the Audience Town platform this year.
That’s not a typo or an exaggeration. Nine hundred.
Every code push, design polish, and new feature release this year was driven by one purpose: to help you sell more homes, more efficiently, and with greater confidence in every decision.
Builders today are facing a complex market. There’s shifting demand, evolving buyer behavior, and endless new pressures on marketing and sales performance. Our mission is to make that complexity simpler, clearer, and more actionable.
So, for the first time, we’re pulling back the curtain. We’ve rounded up the 100 most impactful product updates we shipped this year: the ones that made the biggest difference in how our customers work, think, and win. Because innovation only matters if it moves you forward.
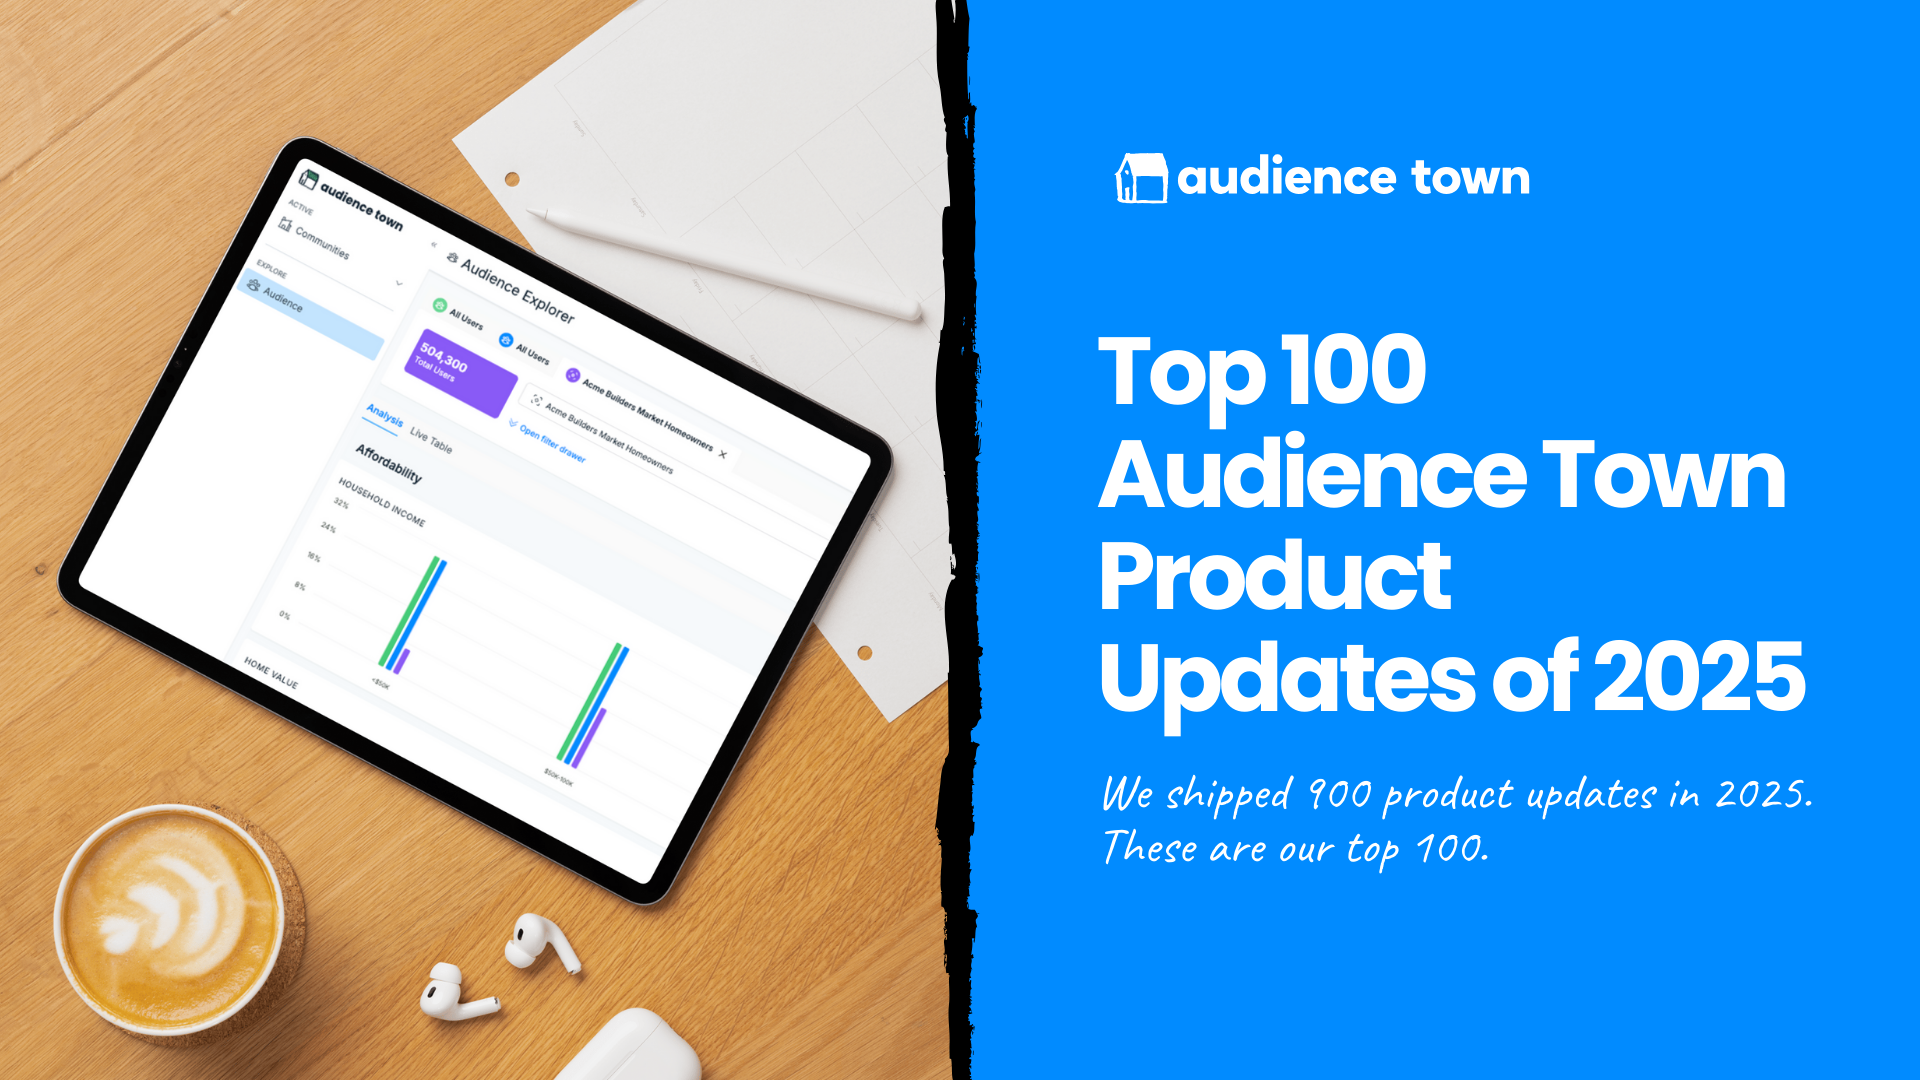
These 100 updates span new product launches, performance upgrades, and quality-of-life improvements across the platform. First, let’s start with the biggest product launches of the year:
Community Assessment
We kicked off this year with a bang. At IBS, we launched Community Assessment (formerly Market Assessment Bundle). Community Assessment is a hyperlocal competitive intelligence tool that gives you a 360-degree view of people, property and leads in your competitive market area.
This solution gives home builder marketers and executives unparalleled visibility into local demand, pricing, buyer profiles, and community-level performance. It’s a game-changer for the entire process of building a new community, from initial planning to closing.
A lot went into this launch. We’ll break down more of the specific releases a little later.
Attribution Add-On
At the Sales and Marketing Leadership Summit, hosted by Jeff Shore, we announced another major release to the platform: the Attribution Add-On.
Using a CRM integration, Attribution gives you the ability to see the entire path to purchase, from anonymous visitor to closed buyer, across both online and offline touch points. Every click, every visit, every lead is all connected. This helps marketing and sales teams work smarter, qualifying high-value prospects faster and aligning efforts around what’s actually driving conversions.
You can now match leads 1:1, enrich lead data with demographics, financial health, and behavioral context, and finally see which channels drove not just leads, but sales.
With Attribution, you act with confidence, knowing which channels and campaigns deliver real results and where your dollars go the furthest.
It’s the gold standard of marketing and sales analytics. If you’ve ever wondered, “what’s actually working?”...the Attribution Add-On has the answers.
This is currently only available in private pilot; if you’re interested in participating, reach out to our sales team.
Audience Targeting Add-On
The second paid Foundation add-on this year is major: the Audience Targeting Add-On. It allows home builders to launch smarter retargeting campaigns on Meta with a single click.
Traditional retargeting is full of waste. It often targets casual browsers, recent buyers, or real estate agents who were never going to convert. The Audience Targeting Add-On changes that. It filters out the noise and focuses only on those who actually fit your ideal buyer profile.
This new feature lets you retarget only your highest-value website visitors, without relying on form fills or CRM entries. For the first time, builders can create ultra-specific retargeting audiences based on real website behavior, demographic data, and buyer intent, then sync those audiences directly into Meta (Facebook and Instagram) with one click. Filter out realtors, filter in move-intenders, exclude bots, and go.
With the Audience Targeting Add-On, home builder marketing finally catches up to the precision of modern advertising (and surpasses it!)
With this new addition, Audience Town is now the only platform in new construction offering custom first-party audience retargeting built specifically for builders, powered by proprietary behavioral and demographic data, and built with compliance in mind.
Even better? You can see the results of your retargeting campaigns inside of Foundation, and actually measure improved performance from Audience Targeting.
Market Explorer (VIP Only)
We kept this hush-hush, but earlier this year, we released a Market Explorer tool to our customers. This VIP only solution allows users to conduct detailed market research (including people, properties, and more) on any ZIP code or metro in the country.
Again, this is only available to current customers.
Now that we’ve covered the biggest releases in 2025, let’s dig into all of the other improvements our customers saw, divided by product:
Foundation
Our core analytics product, Foundation, got faster, smarter, and more powerful in 2025.
Built for home builder marketers, executives, and sales teams, Foundation helps you understand what’s truly driving performance, from lead sources to buyer demographics. This year’s upgrades made the experience smoother, the data richer, and the insights more actionable.
- Website Live Table Rebuild: We rearchitected the Website Live Table to be significantly faster and easier to use. No more getting a cup of coffee while the platform loads. It’s now responsive in seconds.
- Audience Explorer Rebuild: We also rebuilt the Audience Explorer (formerly Audience Segmentation Tool) to be blazing fast.
- Launched Benchmark Audiences for Each Community: Now, you can leverage pre-built benchmark audiences: Homeowners, All Population, Recent Homebuyers, and Renters. This baseline comparison for each community shows you how your traffic and audience stack up to the market. Translation: you can build a perfect buyer profile based on recent home buyers in your area AND compare your visitors to it to see if you’re reaching the right people. Even the best marketing won’t work if the right people don’t see it. Now, you can finally confirm if you’re reaching the right audience in just a single click.
- Website Analysis Charts Overhaul: We’ve made significant changes to the Website Analysis charts. The result? Better data that’s faster to load, easier to read, and simple to action.
- Better Google Search Tracking: We enhanced the ability to track Google Search performance in our analytics 1:1, without conflicting with customers’ UTM parameters.
- Improved Live Table Design: We updated the amount of white space so you can see more rows at once, without needing to scroll endlessly. You’ll see this platform-wide.
- Improved Consumer Attribute Reporting in Audience Explorer: Now, you can filter all of your Audience Explorer charts by individual persona and demographic attribute(s). For example, now you can choose to look only at households in the selected audience where the household income (HHI) is 200k to 250k. Then, the rest of your charts will show the information specific to the households in the audience where HHI = 200k to 250k. This allows you to drill deeper into your audience data, and use it for different marketing and advertising campaigns with ease.
- Improved Scrolling in Audience Explorer: We heard feedback that some users were struggling to see all the charts in the Audience Explorer, so we updated the scroll behavior to make it easier.
- Default Settings Saved: Default view settings now saved in Audience Explorer to make it easier for you to conduct your top reviews easily.
- Offline Lead List Analysis: Now, you can analyze offline lists in platform to get a clearer picture of the consumer profile. This is helpful if you want to understand the lead quality of a list you pull from your CRM, or even a list of leads you might purchase.
- Combined Facebook Referral Source Reporting: We combined all Facebook referral sources into one referral source, to clean up your Website traffic source reporting.
- Updated Site Action Names: Across all tables, the Site Action names now use your terminology.
- New Site Action Analytics: A new Site Action Rate column shows that site action’s conversion rate. In other words, it shows the percent of sessions that completed the site actions you’ve defined as important. This helps ensure that our analysis matches your workflows.
- Helpful User Prompts for Site Actions: Don’t yet have Site Actions set up? Instead of blank charts, we now proactively prompt you to complete setup. Need help with the setup? No problem. Your team of white glove customer support specialists can assist.
- Fixed a Site Action Setup Bug: Typing in the Action Label field no longer spawns multiple forms. A new Site Action is only created when clicking the “+” button.
- Improved Site Action Reporting: We also enhanced the Site Action reporting, so that you can now see individual site actions that you’ve defined broken out. This means deeper visibility into how users behave on your site.
- Improved Behavior Across Tabs: We updated the platform behavior so you can look at different communities across tabs, and get accurate reporting even if CRM integration isn’t set up for all communities.
- Trends over Time Analysis in Audience Explorer: This is a powerful improvement to Audience Explorer. You can now see your audience trends over time, meaning that you can track if you’re doing a better job of attracting traffic that looks like your ICP. If not, you can more easily diagnose what might be going wrong. Did you launch a new campaign that’s driving the wrong visitors? Now you know.
- Updated Paid Keyword Analysis: Instead of “%” symbols, which come from the encoded values, the Paid Search Live Table now shows spaces.
- Improved KPI Accuracy: We’re constantly working to improve the accuracy of KPIs related to anonymous users as they interact with your community’s website. We made some significant improvements, meaning more accurate and actionable data for customers.
- Clearer Google Search and Paid Analysis of Real Estate Professionals: Improves visibility into what percentage of organic and paid search traffic is coming from real estate professionals. Now you can see that data point - “RE Professional” - in your live tables.
- Improved Reporting Consistency: Our WhengineTM, the backbone of Foundation, processes billions of data points daily. This means that we have a lot of data we can analyze for your reports. We’ve now ensured that similar charts on the Audience Explorer and Website analysis pages use the same data sets, so that they present consistent data accordingly.
- Better Audience Explorer Sharing Links: The Audience Explorer page sharable links are more dependable.
- Fixed Share Link Data: Data was showing up differently in platform vs. on some share links. This was due to a rendering mismatch. Now that’s updated, so the data is consistent and accurate both places.
- Tool Tips Platform-Wide: We started launching tool tips (those little information hovers) across the platform to make it easier for users to know exactly what they’re looking at.
- Channel Type Definitions: We're introducing tool tips to show definitions for Channel Type.
- One-Click “Clear All”: Based on user feedback, we added the option to clear all filters in the Audience Explorer page in one click.
- Updated Community Name: Now, when you change your community’s name in the Community Details, you’ll see that reflected in your presentations.
- Include Leads in Attribution Reporting: When we launched, we only matched Tours and Sales in the attribution reports. Based on client feedback, we expanded to include earlier funnel stages - leads - in the attribution reporting.
- Improved CRM Lead Matching: The Audience Town platform now matches your CRM contents down to the record, meaning better coverage of your leads.
- Deeper Cohort Analysis: We improved cohort filtering for re-engagement analysis. You can now isolate specific visitor groups (e.g. return visitors) to understand mid-funnel behavior more clearly.
- Clearer Lead Naming: With Attribution, you can see both anonymous visitors and people who converted and became a known contact in your CRM. These can both be considered “leads,” so we updated naming in platform to make that distinction clearer to users. “Anonymous” leads are those who have visited your site but aren’t in your CRM. “Known” leads are contacts in your CRM.
- Updated Tag Administration: An improved admin "Tags Page" is now available in the new platform stack.
- Consistent Screen and Tab Naming: We made small changes throughout the platform to the naming, to ensure that users could easily understand where they are and what each page is designed to do.
- Improved Column Naming: Similarly, we updated the column headers in both the Website and Paid Search live tables to improve clarity. “Average Page Views” is now “Page Views per Session,” while “Page Views” is now “Total Page Views”.
- Standardized Source Reporting: Facebook, Instagram, and Meta source labels standardized across reporting.
- Standardized Date Reporting: Standardized date format across all tables and exports to improve offline analysis.
- Clearer Column Sorting: We improved the sort behavior on columns, particularly on “median” data.
- Better Export Design: Sticky headers added to PDF and CSV exports for easier reading.
- Cleaned Up Chart Labels in Export: Y-axis and legend labels in exported PDFs and images now render consistently with the on-screen version.
- Easier Exports: Stabilized large PDF and CSV exports to prevent timeouts.
- Small Screen Views: We also improved the audience filtering views on smaller screen widths.
- Exploring Additional Properties: One of the big efforts this year was determining what additional properties we could add to strengthen your analysis of your audience. Boat ownership? DINK household (dual income no kids)? Over 55? Veterans? Real estate investor? Divorced? Language spoken? We’re always rolling out new properties once we’re confident in coverage and accuracy. Here’s the proof...
- Added Occupation: You can now see occupation data in platform, to analyze what types of roles are most common among your buyers.
- Added “Retired” to Occupation: Now, occupation reporting also shows “retired” as a category.
- Improved Reporting on Number of Children: We now have visibility to households with zero children. (National data suggests that about 70% of US households have no children. Keep in mind that about 57% of US adults under 50 years old say that they don’t have and don’t want kids.)
- Fixed Marital Status Data: We had a temporary misreporting of marital status data; that has been fixed.
- Better Correlation in Relationship Status and Number of Children: We improved the correlation between our Marital Status / Number of Children chart, and the independent Number of Children chart. In other words, the story is easier to understand when you’re exploring your data.
- Improved Distribution Analysis for Number of Children: We fixed the filter logic for households with 0 children, so that the chart distribution is easier to read and reflects accurate data.
- Improved Credit Score Data: Not only does Credit Score now populate consistently, but we have a higher degree of fidelity than ever before in this chart across the entire platform.
- Improved Pets Data: We also improved the way that we count pets, so those insights are easier to read and apply to marketing.
- Normalized Number of Vehicles: The Number of Vehicles chart has been normalized (3 cars are no longer misrepresented).
- Improved Visibility in Number of Cars: We now deliver more visibility into households with zero cars.
- Improved ZIP Code Charting: We also updated an issue where the ZIP codes weren’t showing up consistently in Audience Explorer.
Community Assessment Improvements
After we launched Community Assessment, we started making improvements based on customer feedback. Here are some of the best:
- Added Street Names: We added street names to the map view to make it easier for users to navigate the maps and explore properties (especially in areas they know personally).
- Improve Market Trends Report with Listing Data: This year, we continued to improve the listing data we bring into the Market Trends report to increase accuracy and coverage.
- Configure Priority Charts: You can customize your high-priority charts in the Community Assessment view. This helps you focus on what matters most by surfacing your key metrics first.
- Set Your Own Radius: Users can now adjust the radius of their Community Market on the Community Details page. Now you can tailor your community market boundaries for better geographic targeting and market analysis.
- Improved Sold Property Coverage: We significantly increased property coverage. Now, you can see sold properties that were not listed with MLS.
- List Price vs. Sale Price Fix: There was a bug impacting List Price vs. Sale Price charts on the Community Assessment pages. That’s been fixed!
- Better Relocation Reporting: We also ensured that we show previous home locations when our WhengineTM shows that a household recently purchased a home.
- Accurate HOA Reporting: When HOA fee data isn’t provided in source records, the chart no longer counts those cases as “No HOA.” Instead, it shows a clear message that HOA fee data isn’t available. Zero still means “no fee” and is charted.
- Better Reporting in Non-Disclosure States: It’s much more challenging to get the data we need in Non-Disclosure States, but that’s not stopping us. We’ve already made real strides in improving our analytics for non-disclosure states, particularly as it relates to sale price, and that will keep improving in 2026.
- Improved Home Category Definitions: We heard from some users that they were confused by the home categories, so we updated naming and introduced tool tips to clearly define each category.
- Export Data: We heard from customers that they were sharing this data with their team, and needed to export it for board decks and internal strategy conversations. You ask, we answered. Now, you can export the raw data that is presented on the Community Assessment pages.
- Clearer Reporting: Charts no longer hide empty categories. You’ll always see all the options for number of bedrooms, bathrooms, and garage size (even if no properties in your analysis have 3.5 baths). That means you don’t have to question if data is missing.
- Improved Chart Readability: Our customers love the Relocation reporting, but didn’t love that some of the charts were hard to read. We adjusted the tool tip size and position to ensure visibility within the map view.
- Better Trends Over Time Reporting: We also improved the Trends Over Time reporting in the Community Assessment, so that the data is centered and easier to understand.
- Improved Percent Change In Price Reporting: The Avg Change in List Price in Community Assessment now shows one decimal place (for example, 1.3% instead of 1%) and no longer displays incorrect “+” symbols.
- Small Bug Fixes to Reports: Now, reports do a better job of applying the different filters and settings on screen, including in the Buyer Profile and Relocation Trends reporting.
- Improved Home Amenity Reporting Accuracy: We also made fixes to home amenities calculations that displayed incorrect percentages.
- Better Bathroom Reporting: Likewise, we also fixed the inaccurate percentage scaling you may have seen in the number of bathrooms, so that all percentages render correctly.
- Standardized ZIP Codes: Now all ZIP codes use the standard 5-digit format.
- Enhanced Map View: We also adjusted the map view so that maps aren’t clipped.
- PDF Export: You can now export your Community Assessment reports to PDFs for easier sharing! We also improved the PDF export design so that the layout is cleaner.
Market Explorer Enhancements
This VIP-only solution saw some enhancements this year, too:
- Added Dwelling Type: We made it so users can filter listings by dwelling type (i.e. townhomes, condos, single family), to make market research and comparisons easier.
- Distinguish between Condo vs. Townhome: Originally, we bucketed condos and townhomes together in our analysis. Based on feedback, we broke those dwelling types out into two separate categories.
- Improved Comparison Toggles: Now you can select between All Listings, New Construction Listings, Resale Listings, All Sales, New Construction Sales, Resale Sales.
- Added Report Functionality: This beloved update allows you to generate a report from your research as either a sharable link or a PDF. Users consistently tell us this seemingly small update makes the data so much more actionable.
Attribution Add-On Improvements
In the lead up to launching the Attribution Add-On, and in the months since, we’ve consistently pushed updates that make these insights easier to use and action:
- Pilot Program Launch: We kicked off our pilot program of the Attribution Add-On with a few select clients to begin identifying feature improvements and expanded use cases with live data and real customer feedback.
- Beta HubSpot Integration: We launched the beta version of the HubSpot integration earlier this year.
- Beta Lasso Integration: We also launched the Lasso integration beta earlier this year.
- Improved Deduplication Logic: We prevent overcounting of contacts by ensuring that duplicate contacts are matched and collapsed when syncing CRM data to Audience Town.
- Customizable “Engaged” and “Lost” Logic: Every customer defines their lead funnel stages slightly differently. Now, we allow you to customize your definition of “Engaged” and “Lost” leads.
- Improved Source & Funnel Reporting: We expanded CRM visibility inside the platform, giving users more insight into which leads are active and where they originated.
- Map Pin Interactions: Clicking on map pins in Assessment and Market Explorer now displays more relevant property-level insights.
- Enhanced Designs: Attribution Path view now includes a clearer, step-by-step conversion flow.
- Clearer Lost Lead Reasons: One of the major perks of the Attribution Add-On is that we reveal which leads are “Lost.” We added additional clarity in the Live Table about why a lead was categorized as “lost”: no activity in the sales funnel, a simple change of address or proof that they purchased another property.
- Improve Lost Lead Data Depth: We made it easier for users to see why a lead might be categorized as “Lost” by showing proof of purchase, and revealing the competitive details of the other property. This type of closed-lost analysis helps home builders see where to optimize their process to close more qualified leads.
Audience Targeting Add-On Updates
The Audience Targeting Add-On makes all of your top of funnel marketing activity actionable at the mid- and bottom-of-funnel with smart advertising retargeting. Here are a few of the releases that customers loved:
- Streamlined Meta Integration: We improved how we integrate with Meta, making user onboarding much easier.
- One-Click Send to Meta: We made it possible to send your custom retargeting audiences to Meta via a single click.
- Behavior, Demographic & Lifestyle Filters: You can drill deeper into your retargeting audiences, filtering by behavior, demographic details, and even lifestyle filters (like luxury car ownership). This lets you refine your audiences for more effective paid campaigns.
- Built-In FHA Compliance: We designed clear guardrails to help ensure ad campaigns meet compliance standards. You can see certain filters for your analysis, but can’t use them if you’re sending that list to Meta.
- Clear Error Reporting: If an export fails for any reason, you’ll see clear error reporting to save you time.
- Audience Filtering By Community: We improved filtering and tagging to help you build and launch community-specific campaigns.
This is a lot, but it’s still not everything.
Behind the scenes, we strengthened our data pipelines, modernized core systems, and dramatically improved speed and stability across the platform. From faster analytics processing and cleaner data exports to smarter chart logic and more reliable CRM syncs, these updates are what make every Audience Town experience feel effortless.
I want to take a moment to thank our team for launching so many improvements this year. We have colleagues across the globe, and each and every contribution makes a difference.

What’s Next for 2026
We’re not slowing down.
In 2026, we’ll keep expanding what’s possible with segmentation, activation, attribution, and AI, all to make your insights sharper and your marketing stronger. Our mission remains the same: to give every builder, marketer, and sales leader the clarity and control to win in a changing market.
Thanks for being part of this journey!
Want a closer look? Book a demo and see the future of home builder marketing in action.